What exactly is the Bell Curve IQ graph and what does it tell us?
Imagine a group of 1000 people who took an IQ test. In theory, you’d expect more to have an average score than an unusually high or low score. If you plot all the scores on a chart, it will look a little like a bell.
The bell curve IQ graph is a visual representation of scores of a group of people when they have taken an IQ test.
Let me ask you
What is your IQ score?
…may be 100, 120 or 140 out of 1000 item scores!
What does it mean?
Frankly speaking, nothing unless a psychologist interprets the score in statistical and analytical modes.The bell curve graph is a bell shaped curve utilized by the authors of “The Bell Curve: Intelligence and Class Structure in American Life” to explain differences between different people effectively.
You will discover below the significance of the shape of the graph.
The Significance of the bell curve IQ graph
It is not unusual to see figures represented in columns.
However, sometimes you can’t see the significance of the data. Graphs are a straightforward way of visually revealing any trend in a group of figures. Consequently, the bell curve IQ graph is a perfect representation of the theory on which the IQ system is based.
There are fewer people around who are exceptionally intelligent. These ‘high performers’ will be in the minority, as shown in gray on the right of the bell curve IQ graph above. The same also applies to those with limited intelligence. Those with remarkably high levels of intelligent are seen as genii. It is sad because those with an unusually low level of intelligence usually suffer from some form of mental deficiency. The very low performers, as seen in gray on the left of the graph above, tend to be ‘retarded’ or ‘mentally challenged.'
However, the shape of the graph reveals one principal characteristic. The majority of people all have average performance or an average IQ. That is precise as you would expect and at the peak of the bell curve IQ graph - IQ score should be 100. This is a graphical representation of the basis for IQ scores as 100 is deemed to be the ‘average’ score. In other words, people of average intelligence will have an IQ of, or around, 100.
Further interpretation of the Bell Curve IQ Graph
It is unusual to have a scale which sees the figures of 0-30 being of little relevance. Anyone with a potential IQ in this range would be mentally incapable of taking the test. Nobody has ever been proven to have a specific IQ in this range. The law struggles with particular values for IQ tests because no two tests are the same. If a candidate takes two IQ tests, their IQ will likely not be identical. It is accepted that an IQ score has a +/- range of 5%.
In most American states anyone with an IQ of 70 +/- 5% is classed as being mentally challenged. They will not be judged in the same way as someone with an IQ over 75. Those with impaired mental ability are often less aware of the consequences of their actions.
From the late 1990’s it was decided that there would be no upper limit to an IQ score. It had previously been set at 200. However, the world has ‘shrunk,' and exceptionally gifted people now have more opportunities to shine. Looking at the bell curve IQ graph, you can see that only 0.1% of the population can exceed 145. Once an IQ level reaches 160, those people are regarded as genii (geniuses).
What the bell curve IQ graph shows?
Approximately 68% of the population have an IQ lying in the range 85 – 115. The ‘super-intelligent’ and those deemed to be of insufficient mental capability makeup 4% of the population. The graph also indicates that everything regarding intelligence in a population balances itself out.
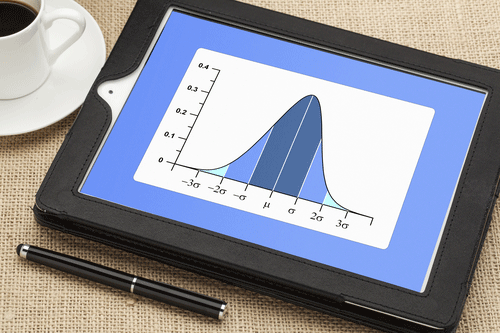
Look at the graph. The number of ‘feeble-minded’ people appears to be same as ‘super-intelligent’ people. It may seem too convenient a result to you. However, you have to keep in mind the basic principles to understand IQ scores.
The whole principle of the IQ system is that a score of 100 is taken as an average The bell curve of the graph shows that there are equal numbers on either side of this average score. It means there are as many ‘super-intelligent’ people as there are numbers with severe mental disability. It is impossible to know the lowest IQ level. Similarly, the highest IQ cannot be established.
From the top ten IQ’s recorded, there is some disparity in the scores. Stephen Hawking has an IQ of 160 and is well-known. He is remarkably intelligent. However, the top two IQ scores are at 225, which is a massive leap from 160. To balance these scores out, you would need two people with an IQ of -125!
Practice with Free IQ Tests
Share Your Thoughts!
We find value in differences between learning, interpreting and overall opinions. Please share your thoughts freely about this topic, but always remain respectful. You can preview and edit on the next page before your submission is sent in. You will also be informed about this site's privacy policies. Thank you for your contribution.

Recent Articles
-
What type of test did I take
Apr 04, 22 04:09 AM
I was given a psychological test years ago, but wasn’t told what it was for. The rating used a bell curve and my score fell in the above average not yet -
ﹰﹰﹰﹰﹰﹰﹰGOOD
Aug 13, 21 03:20 PM
 Since the enneagram test helps people to understand their strength and weaknessess. And helps them remove their weaknesses then the test is good
 -
Knowing the inner me
Aug 13, 21 03:17 PM
Sometimes I ask myself that is this my behaviour or not? Because I am really shy and I lack confidence, I find it hard to socialize with other people.I